
Key takeaways
- Scale within a model or across many: TMDL scripts, C# scripts, notebooks, and Tabular Editor each suit different scopes of work, so match the tool to the task.
- Tabular Editor is for one model at a time: As an IDE it focuses on scaling tasks within a single model, with a CLI for CI/CD deployment scenarios.
- Notebooks scale across published models: Semantic link and semantic link labs let centralized teams survey, analyze, and change many models and reports programmatically.
- Adopt a toolbox mentality: Knowing when to use what matters more than any single "best" tool, including AI, the TMDL view, the DAX query view, and VS Code extensions.
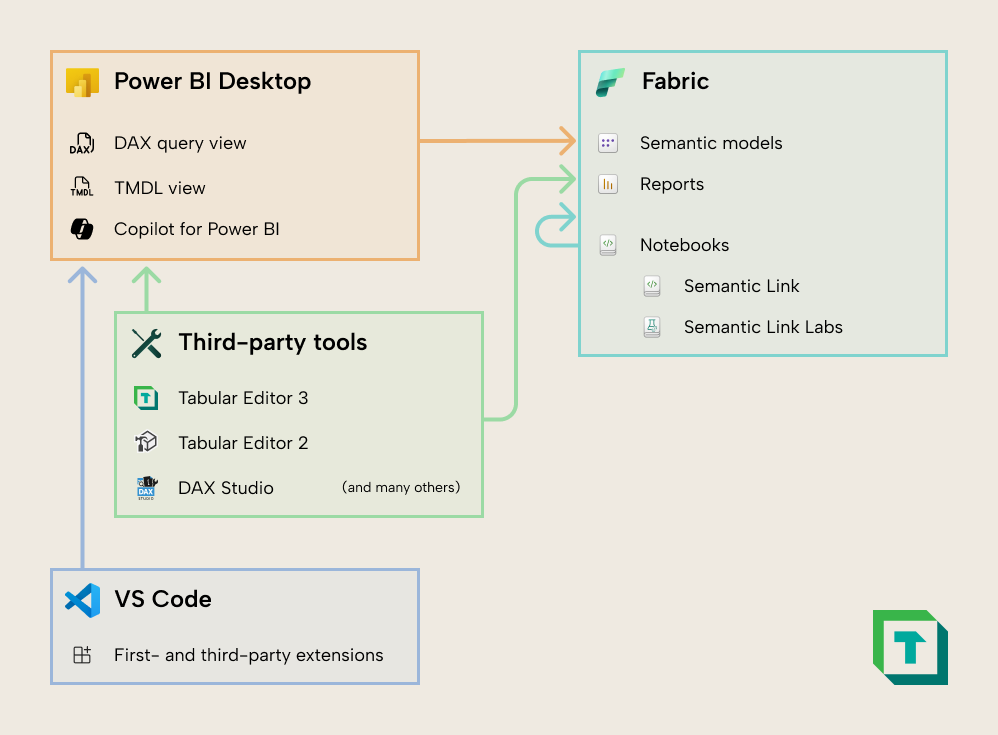
In the previous article, we explained that Microsoft have released several new features to help Power BI developers to do more and enhance productivity. These tools are additions to Power BI Desktop or Fabric that help fill existing gaps in the product. You can use them with or without third party tools like Tabular Editor, which is an integrated development environment (IDE) to help you make better semantic models as effectively as possible.
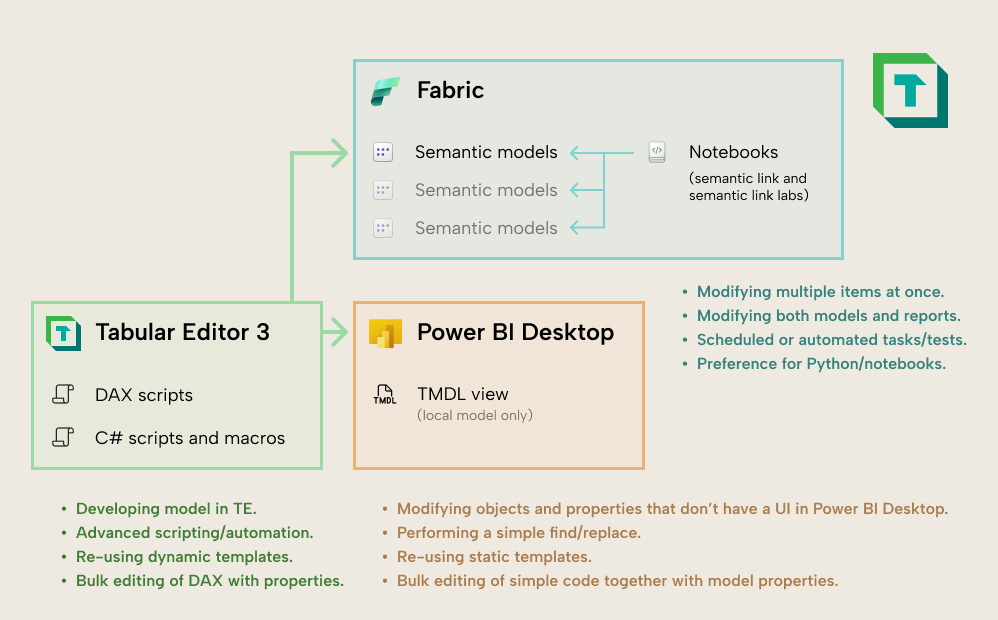
The following diagram (from the previous article) is a high-level overview of these features and tools, and how you can use them with local models (in Power BI Desktop) or remote models (in a Fabric or Power BI workspace).
We are releasing free introductory courses about all these features and tools, which you can find on your learning platform at Tabular Editor Learn.
In this article, we will explain some of the differences between these tools and features, but also how they are similar: that they help you scale your tasks both within and across semantic models.
Tools that help you scale
All these tools have one thing in common: they help you be productive and effective by scaling your tasks. By scaling we mean that you can either:
- Streamline, automate, or batch-apply a repeated task across many instances. An example is when you want to rename many measures at once, rather than painstakingly doing this repetitious task in the data pane.
- Reuse objects and patterns that you already developed in other models you manage or in new models you make. An example is when you reuse a date table that is already organized into display folders and set with the right properties.
- Do new things that were not possible before that help you answer questions or solve problems relating to your data strategy. An example is setting up basic automated regression testing by scheduling DAX queries.
Each of these tools help you scale tasks in different ways, which we explain and compare in the following two sections, looking at how they help you scale within a model and then across multiple models. In these sections, we will also introduce and explain each of these tools in a bit more detail.
Scaling tasks within a single model
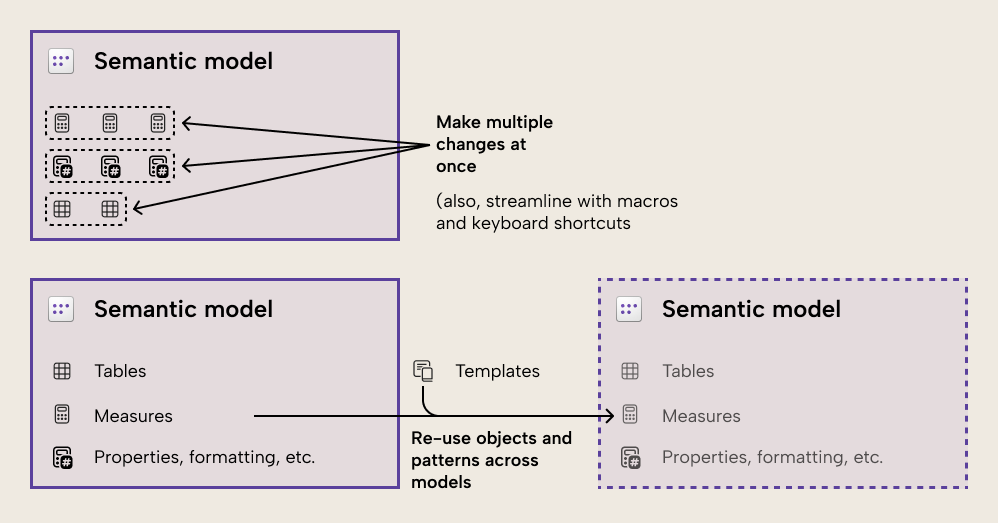
Within a model, you can scale tasks by batch applying changes and performing many operations at once, or reusing various objects and patterns by applying atomic design principles.
Tools that can help you do this include Tabular Editor, the TMDL view, the DAX query view, and notebooks (for published models and if you have access to a Fabric workspace).
Tabular Editor
A core focus of Tabular Editor is to give you tools and methods that you can use to scale any task within a single model. This is where Tabular Editor excels, and how a developer saves the most time or gets the best experience when working with a model. A few specific ways that Tabular Editor enables scaling of tasks include:
- Applying changes in bulk to common properties that you multi-select.
- Batch renaming fields.
- Refactoring and debugging DAX code.
- Using C# scripts to streamline and automate certain tasks or reuse certain objects and patterns. C# scripts are further enhanced by:
- Making scripts context-sensitive to what you select in the TOM Explorer.
- Saving reusable scripts as Macros.
- Linking Macros to custom keyboard shortcuts or toolbar buttons.
- Leveraging advanced C# features like pop-up and info box windows.
A more novel way people scale tasks in Tabular Editor is by using C# scripts that call LLM APIs. These scripts send a prompt together with model context (such as the objects you select and a sample of values) to generate output. Community examples include:
- Suggesting field descriptions.
- Suggesting translations.
- Suggesting new DAX measures in a model.
AI, Large Language Models (LLMs), and Copilot for Power BI
You can't really talk about tooling without touching on generative AI. People mostly use AI to generate suggestions for properties (like descriptions, translations, and display folders) or code (DAX or Power Query; M).
In the context of scaling tasks within a model, AI is helpful to aid in bulk-generation of these properties. Copilot for Power BI is of limited help here, since it can only make bulk changes to a model via the DAX query view (which we discuss further below). In general, though, when it comes to scaling tasks, you are going to be leveraging AI through another tool, like C# scripts in Tabular Editor (which call an API, like Claude from Anthropic), or the TMDL view (where you can open TMDL scripts in VS code and edit them with GitHub Copilot).
To be direct, we're not yet at the stage where AI reliably makes the semantic model for you. At best, it amplifies and augments existing tools to make them more useful or convenient.
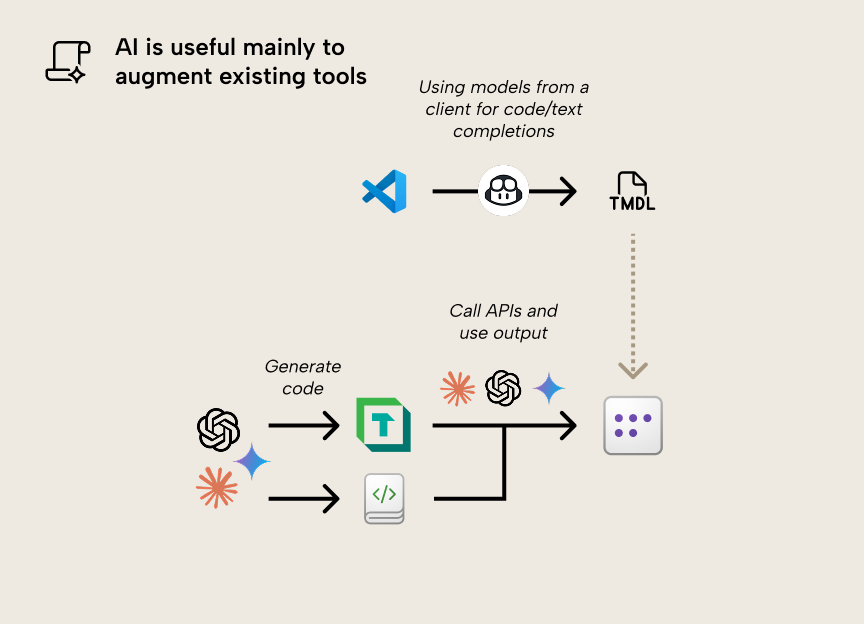
- LLMs like Claude can generate code for C# scripts and notebooks, making it much easier and more accessible for anyone who can describe their problem. If you can articulate your problem, you are much more powerful now than before these tools existed; communication and critical thinking matter more than ever.
- C# scripts in Tabular Editor and code in notebooks can call APIs for LLMs to use them to process parts of your model as input with a text prompt and generate output like code, descriptions, properties, and entire model objects.
- GitHub Copilot in VS Code can write and complete TMDL scripts for you, which is useful when you want to make bulk changes beyond a find and replace.
- Copilot for Power BI can generate DAX queries, including defined measures which you can add to your model.
In the future, we are likely to see further advances in how AI helps you build a semantic model, but also how AI uses your model to answer data questions or even how AI agents execute certain pre-instructed tasks.
TMDL view
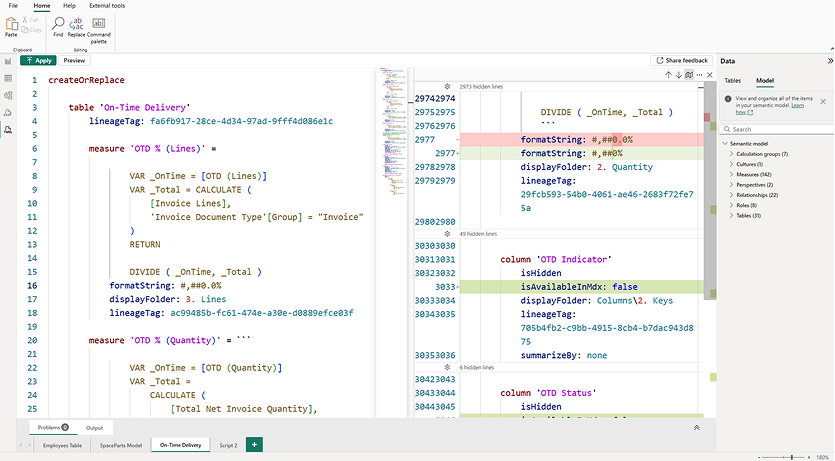
The TMDL view is a separate window that you can view in Power BI Desktop like the canvas (where you add visuals) and the data view (where you view and interact with table data in an import model). In this window, you can create one or more TMDL scripts, which let you directly make changes to model metadata (in TMDL format). Any changes that you make can be previewed with a diff of the (TMDL) model metadata, showing it before and after you run the script.
Here is an example of what the TMDL view looks like, with a TMDL script on the left that has several changes previewed beside it:
The Tabular Model Definition Language (TMDL) is a serialized model metadata format from Microsoft. According to its creator Mathias Thierbach, it was inspired by the YAML-like DAX script syntax in Tabular Editor 3. The purpose of this metadata format is to make the model metadata easier to read and manage, such as with source control. You can save your model using the TMDL format in Tabular Editor, or when you save in Power BI Desktop as a Power BI Project (or .pbip format). You don’t need to save your model as TMDL or PBIP to use the TMDL view.
It's worth clearing up the confusion: “TMDL” isn't the same as “the TMDL view”. TMDL is a serialized model metadata format; in the TMDL view you create TMDL scripts that show your model metadata using that format. These scripts have a limited syntax, not comparable to Python or C# scripts. The difference between a TMDL script and TMDL metadata is that the script contains a few keywords (verbs) like createOrReplace; more verbs, similar to TMSL scripts, will likely be added in the future.
You can drag one or more objects onto the TMDL view (from the data pane or model explorer) to generate a TMDL script for them. You can even create a script for the entire model this way. Any scripts you save in a PBIP file are accessible as .tmdl files, which you can also open and manage from VS Code with GitHub Copilot, for instance. As of version 3.21.0, Tabular Editor 3 also lets you click-select to get TMDL scripts from your model or any selected object while you work.
The following diagram shows how you can access any TMDL scripts that you save in Power BI, if you save your model as a Power BI Project (.pbip) format.
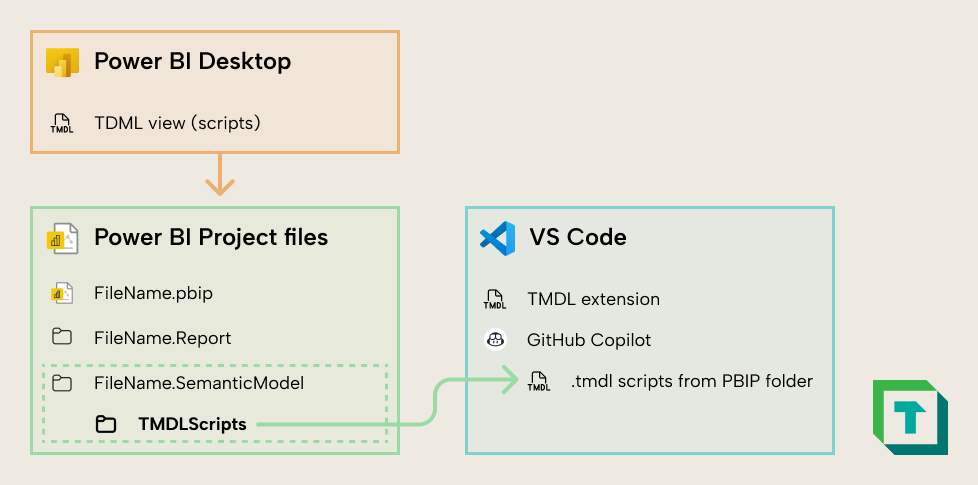
Note that you can also create C# scripts and macros from Tabular Editor in VS Code with a similar approach, as explained by Microsoft MVP Bernat Agulló Roselló.
Thus, use-cases for the TMDL view include (but aren’t limited to):
- Editing multiple objects or properties, at once.
- Making changes or additions that aren’t supported by the Power BI Desktop UI.
- Performing find/replace over multiple objects, expressions, and properties.
- Using LLMs to make multiple changes at once, like suggesting descriptions, translations, and so forth. The easiest way to do this is by using GitHub Copilot in VS Code, ideally together with the open source VS Code TMDL extension from Microsoft.
- Viewing Power Query (M code) without opening the query editor.
- Reusing static templates, like a Date table or Last Refresh table.
We have tutorials and examples on these use-cases and more in our course The TMDL View: A Practical Introduction, which we are releasing in May 2025.
There are also some considerations and limitations to keep in mind with TMDL scripts:
- TMDL scripts can only apply to local models and only work on one model at a time.
- These scripts are “all-or-nothing”. This means that when you create a new TMDL script for a change (by dragging one or more objects to the canvas), then continue to develop your model with the user interface, the script will not update to reflect your new changes. It contains a point-in-time snapshot of the objects when you create the script. Thus, if you rerun that script, you will undo any changes to those objects you made in the UI since you added the script to the TMDL view.
- TMDL scripts do not have code assistance, syntax-checking (for errors), or syntax highlighting for DAX, Power Query (M), or other languages; only TMDL. Thus, it isn’t optimal when you need to make changes to this code beyond some simple corrections or a find/replace.
- They don’t show the default values for atypical properties or explain what those properties do. You can press
Ctrl + Spacebarat any time to see the list of valid properties (or keywords), but understanding what those properties do means that you must first check Analysis Services documentation or explanations from other sources. - You can get yourself into trouble with TMDL scripts. For instance, if you drag a table onto the TMDL view and enable the advanced property
IsPrivate, the table will disappear from Power BI Desktop. If you then delete that TMDL script from the TMDL view, you have no easy way of making that table visible again; you have to script the entire semantic model to see it, since the table disappears from the data pane. Alternatively, you can manually rewrite that TMDL script, modify the metadata files, or use a third-party tool. - There are cases where using a TMDL script is more difficult or time-consuming than using the user interface of Power BI. For instance, deleting measures that belong to perspectives can lead to errors in a TMDL script because of dependency chains. However, shift-selecting these measures in the “Model view” and deleting them will handle this for you without issues.
- The script only applies to the current model. If you want to reuse it in another model, then any references to the previous model either must exist or be replaced to avoid syntax errors. This contrasts with a C# script or Macro in Tabular Editor, which can be made context-sensitive to selected objects (such as
Selected.MeasuresorSelected.Columns) so that actions and patterns are reusable irrespective of whatever model you’re connected to. - TMDL scripts also aren’t scripts in the typical sense. They more closely resemble DAX scripts rather than C# scripts in Tabular Editor, since you view and change metadata for that model. You can’t use typical programming functionality to drive changes (like function calls, if/for/while keywords, etc.), or make those changes context sensitive or dynamic. In contrast, C# scripts allow you to leverage any aspect of the C# language, including advanced components like creating on-the-fly UI elements, performing API calls, and more.
- Since TMDL is relatively new, it is sparse in training data of LLM / AI tools. That means that getting LLMs to generate TMDL scripts (rather than making targeted changes) is prone to hallucinations and mistakes. To compensate for this, you should provide multiple examples to LLM tools as context before you work with them in these scenarios (avoiding cases where examples have sensitive or confidential information).
These limitations are minor. The TMDL view is a great entry point for model developers to use code to manage semantic models: it's simple, accessible, and useful at any experience level.
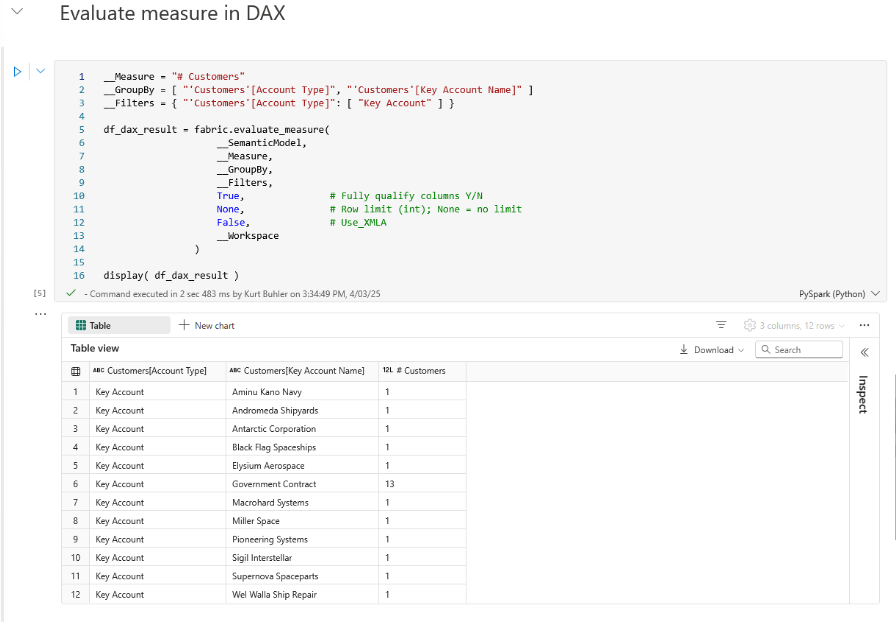
DAX query view
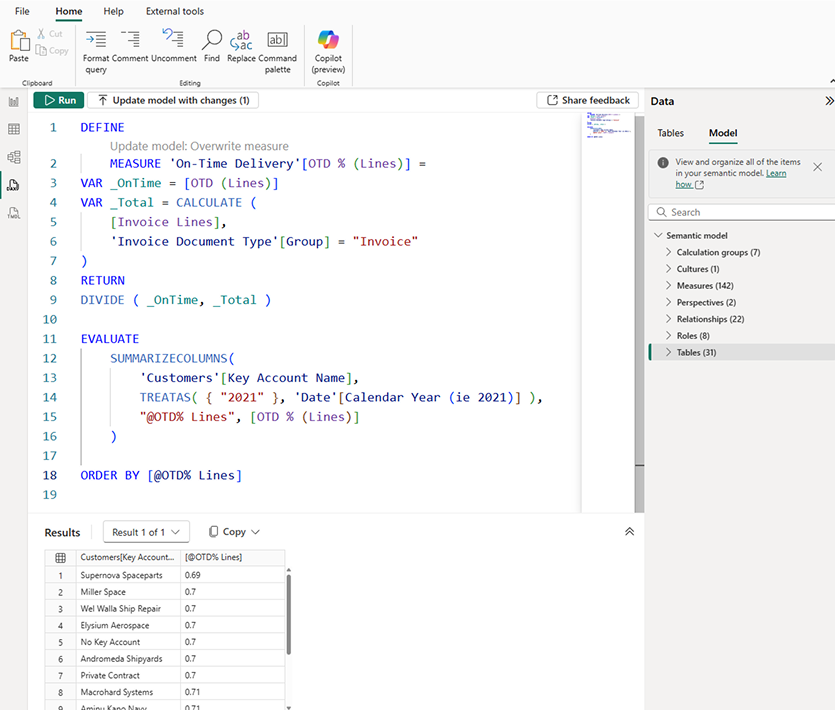
Like the TMDL view, the DAX query view is a separate window that allows you to write DAX queries that you can use to query your model. An example of a DAX query in the DAX query view is below:
Use cases for the DAX query view include (but are not limited to):
- Testing, exploring, or analyzing data in a model by writing DAX queries. You can do this both in a local model open in Power BI Desktop and a published model that you are connected to using live connect, DirectQuery or Direct Lake.
- Bulk-authoring or modifying DAX measures by right-clicking one or more tables and defining their measures (or all measures in the model).
- Generating DAX queries or measures by using Copilot for Power BI. A common example is copying a visual query from the Performance Analyzer pane, and then asking Copilot to simplify and add comments to the query to explain it (but be sure to validate that the result and performance are the same).
- Iteratively or incrementally developing complex DAX code by defining measures in a query and using the query to debug or validate the measure result.
- Exploring or documenting model metadata by using the new INFO functions.
The DAX query view in Power BI Desktop is powerful and useful. However, some people in the community ask about the difference between this and the DAX query views in DAX studio or Tabular Editor.
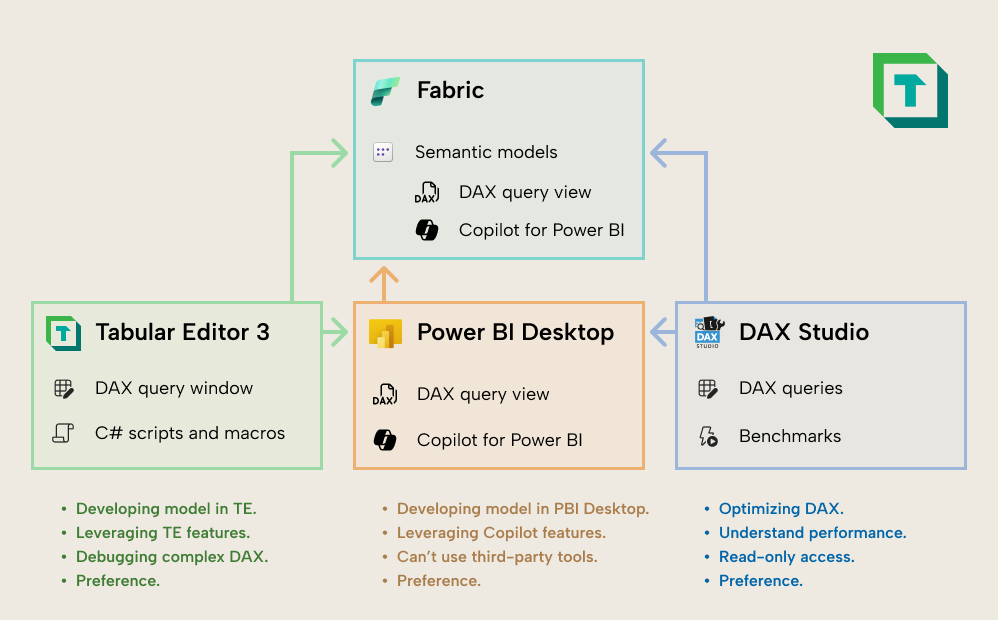
You typically use DAX Studio over the DAX query view in Power BI Desktop for the following reasons:
- You want to test model (or report) performance or optimize DAX. DAX Studio provides detailed views on query execution timings, query plans, and supplemental information like the VertiPaq Analyzer statistics. You can also run performance test replicates (multiple times) and test your model with warm or cold cache.
- You want to view and use your queries as you develop the model. The DAX query view – like the other views and panes of Power BI – cannot be popped out and repositioned. Clicking between the different views many times can waste a lot of time, so many developers prefer to use a separate tool for queries simply to better organize their workspace.
- You only have read access to the model. Unlike Tabular Editor, DAX Studio doesn't require admin permission to connect to a model and run queries. As such, you can use DAX Studio to run queries and do performance benchmarks even against models you only have read access to. You can also run queries from Power BI Desktop if you have build permissions by connecting to the model with a live connection or with DirectQuery.
You typically use the DAX query view in Tabular Editor 3 over the DAX query view in Power BI Desktop for the following reasons:
- You are developing your model in Tabular Editor. If you use Tabular Editor as your primary model development tool, then you need a way to write and run DAX queries in your workspace or layout. The DAX query view is intended for this.
- You are debugging complex DAX. Tabular Editor has a DAX Debugger which you can use to walk through each step of a DAX evaluation to understand intermediate results, zoom in on filter context, and watch variables or ad hoc expressions change depending on where you are in the code.
- You want to leverage specific features of Tabular Editor. There are many features in Tabular Editor which help you save time when writing DAX, provide a more convenient developer experience, or help you understand how DAX works. Other features might also be helpful, like:
- Impersonating users or roles to test RLS and OLS in a query scope.
- Exporting query results with the push of a button.
- Evaluating partial queries (selection).
- Formatting queries, with control over that formatting (like short-line vs long-line).
- Saving queries for reuse in other tools or automations (like notebooks). Note that you can also save and reuse DAX queries from the DAX query view if you save your model as a PBIP file.
- Leveraging code actions or other DAX refactoring features to quickly streamline and improve your DAX code
The DAX query view in Power BI, DAX Studio, and Tabular Editor all let you write and evaluate DAX queries; it might just come down to user preference about which one you use. However, there are specific cases when you might opt for one or another tool.
None of these query views is “better” than another; it's like comparing screwdrivers. Focus on when to leverage each, depending on your problem. This “toolbox” mentality sets you up for more success than sticking to one preferred tool.
Notebooks (semantic link; semantic link labs)
In Fabric, you can create code notebooks, where you can write and run code in cells, such as Python, Spark, and other languages. Notebooks are a structured way to construct and present code for transforming data, managing artifacts, or sharing analyses and visualizations. Each cell's output shows beneath it, and you can schedule notebooks to run and share them with collaborators.
Notebooks in Fabric are unique because there are two exclusive libraries that enable you to connect to, use, and manage semantic models: Semantic Link, and semantic link labs.
With a few simple functions these libraries connect to published models in any workspace (not just Fabric, but also Pro or PPU workspaces for some functions). That enables not only model analysis but also creating, changing, and managing models with Python. The libraries are streamlined enough that you don't have to be a Python expert to get value from them.
With notebooks, you can view or change any model property by using Python code. When you set up the notebook appropriately, you can also easily reuse it as well, changing just a few constants to apply changes to other models or reports. The following diagram shows some examples of when you might choose between DAX scripts or C# scripts in Tabular Editor, notebooks, or the TMDL view to make model changes:
Notebooks are unique for reasons like the following (but not limited to these):
- If you do know Python, you can leverage and apply that knowledge to do significantly more with notebooks than the out-of-the-box functions of the standard libraries. We give many examples of this in the later modules of our coming Notebooks introduction course on Tabular Editor Learn.
- You can schedule notebooks easily to run daily, weekly, etc.
- You can read and write files from OneLake data items very easily.
- You can connect to and read, use, manage, or change items in Fabric.
- You can use the Power BI or Fabric APIs without setting up an application registration or other complex technical steps.
- You can use User Data Functions (UDFs; not to be confused with DAX User-Defined Functions or DAX UDFs) and custom environments or libraries.
When you are developing a single model, you can use notebooks to save time with the following tasks (which are some examples, and not a complete list):
- Batch-applying changes to properties, code, and more. For instance, you can generate measure descriptions or translations,
- Reusing model objects and patterns that you save in a notebook. These objects and patterns can be made more flexible than TMDL scripts, since you can leverage the Python language to generalize the template. However, you still will likely need to adapt either the template or the result in most situations.
- Automating certain tasks by running notebooks on a schedule. For instance, you can run DAX queries against a model to test it, or use the Best Practice Analyzer to check for BPA rule violations, saving these outputs to OneLake for later reporting and analysis.
- Copying, deploying, or migrating full models (such as between workspaces, or from import to Direct Lake storage mode, and vice-versa).
Notebooks also have some limitations that you should keep in mind:
- You will only have code assistance for the language you are writing in the code cell. If you want to add DAX to a model or access TOM properties, you can’t benefit from syntax highlighting, code completion, and other code assistance features.
- You can only modify published models, or model metadata that has been uploaded to OneLake. You can’t modify local models open on your desktop computer.
- While there are many tools and libraries that make writing code easier, code is still going to be your primary way to do things in a notebook, which can be a big technical hurdle for many non-technical users.
For a semantic model, a notebook is more likely a supplemental tool for specific tasks than your primary development tool. You can build and test a model entirely with Python code, but it's rarely the most efficient way compared to a user interface in Power BI or Tabular Editor, which gives less friction for development, exploration, and organization.
The benefits of a notebook for a single item are more significant for reports, which until now, have had no official tools to support bulk changes outside of Power BI Desktop. For instance, with a bit of Python code, you can now make formatting changes to multiple visuals in bulk, including changing colors, fields, settings, and more. It’s also possible to reuse report pages, visuals, or visual elements as templates for new reports, with significant potential time-savings for report developers. We give many examples of this in the later modules of our coming Notebooks introduction course on Tabular Editor Learn.
Again, a notebook isn't a primary development tool for reports, but a specialized one to reach for when you can save time or do things a user interface can't. This is particularly true when it comes to scaling across items (rather than within them), which we discuss, below.
Scaling tasks across many models
Typically, semantic model developers, Fabric administrators, or other roles manage or govern more than one model in a workspace and organization. In these scenarios, they need the tools and resources to be able to check, monitor, and possibly even change multiple models at once. In organizations that have a self-service model where decentralized analytics teams or business users make their own models, this is particularly important for the following reasons:
- Governance: Finding semantic models that cause issues or create risk, and mitigating that risk while focusing on enabling users in various ways.
- Fabric capacity management: Models that have too frequent refresh schedules or that are poorly optimized can impact shared resources and degrade performance for everybody who uses a Fabric capacity.
- Auditing, monitoring, and user support: Understanding the contents of your tenant and how they change over time, as well as being able to help users solve problems that they run into in their models.
The following tools help you scale tasks across many models.
Tabular Editor (Command-Line Interface; CLI)
Since Tabular Editor is an IDE, its focus is to help you work with one model at a time. You can certainly have multiple instances of Tabular Editor running at once (for example to copy measures, tables, columns, or properties from one model to another). However, the focus of Tabular Editor is for you to scale your tasks within one model rather than across many models.
That said, Tabular Editor does have a command line interface (CLI) which you can use in custom solutions with multiple models. For instance, you can automate DAX queries against models using the XMLA endpoint or run the best practice analyzer (BPA) to identify BPA rule violations. However, the main intent and purpose of the CLI is to support deployment in CI/CD scenarios.
Notebooks (semantic link; semantic link labs)
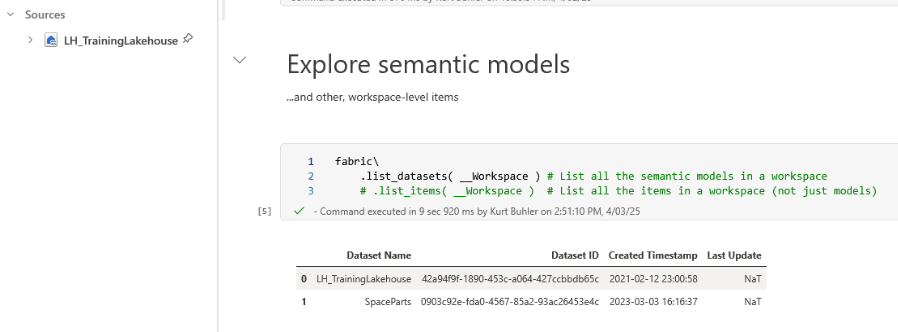
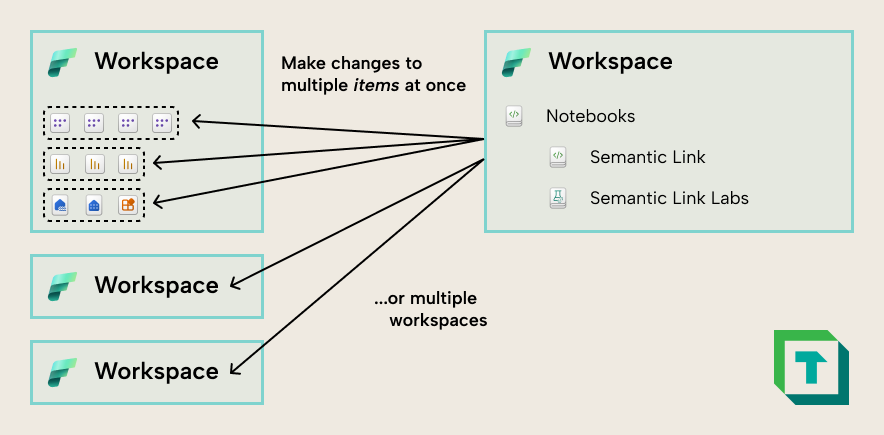
The main benefit of notebooks is that you now have an easy way to programmatically make changes to multiple published models and reports at once, thanks to semantic link and semantic link labs. You no longer have to wade through complex technical set up to do basic tasks with the APIs, like check the total number of semantic models or reports, automatically run queries against a model and validate the result, and more.
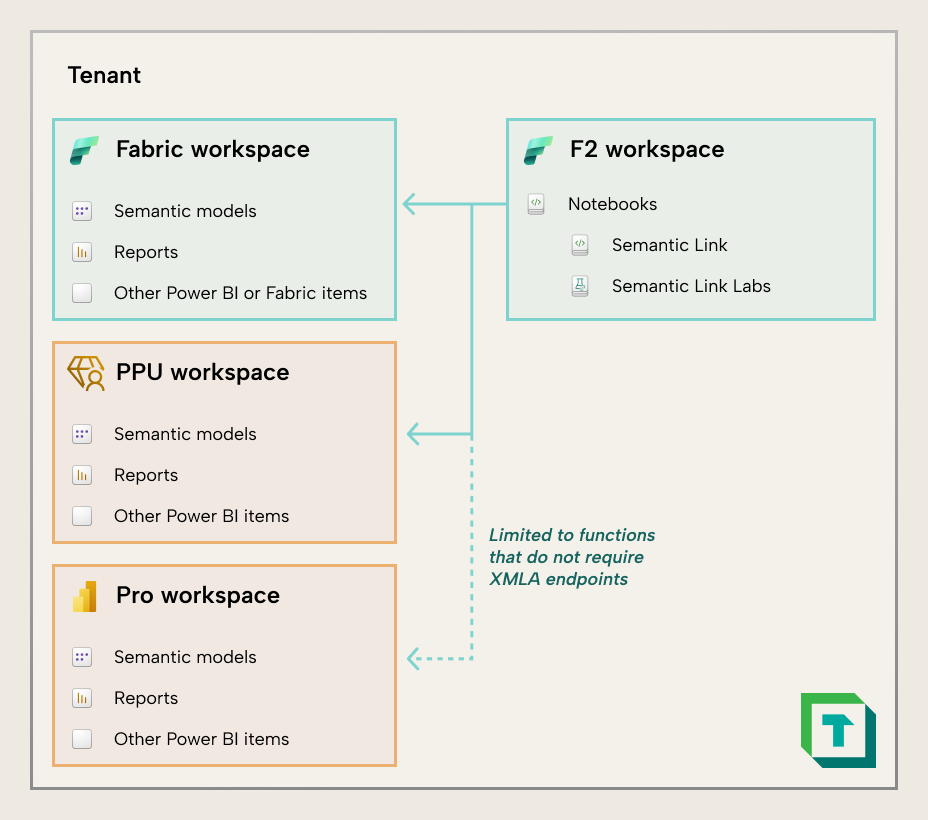
This makes notebooks an invaluable tool for centralized teams or administrators who manage a Power BI tenant. This is true even for organizations who haven't adopted Fabric, since notebooks can be used to survey, analyze, and even change items in workspaces with PPU and Pro license modes. This means that a small team of experts can leverage a single F2 workspace that they pause-and-unpause, getting tremendous value across their tenant for a few Euros each month.
Note however that you can only use a subset of the semantic link and semantic link labs functions with Pro workspaces. Some functions use the same libraries as Tabular Editor to interact with the model, and thus require an XMLA read/write endpoint is enabled. For instance, you can’t run the BPA over models in a Pro workspace.
VS Code extensions like Fabric studio
There are also extensions which let you manage items in a workspace and their definitions, such as Fabric studio (from Gerhard Brueckl), Microsoft Fabric, Fabric Data Engineering, and Fabric User Data Functions (UDFs) (From Microsoft). These extensions are particularly useful if you use VS code for other tasks, such as local development of notebooks or as a Git client for committing changes to your semantic models and reports. Fabric studio in particular can be a convenient way to manage and use workspace items, while also providing easy access to their definition.
For further reading
- TMDL scripts, notebooks, and Tabular Editor: how does it all fit together? (Tabular Editor). Part 1 of this series, covering the ecosystem overview and where each tool sits before diving into the scaling comparison in this article.
- Five ways that the TMDL view can help you be more productive in Power BI (Tabular Editor). A companion piece drilling into specific TMDL view use-cases that complement the broader scaling discussion here.
- TMDL overview (Microsoft Learn). The official reference for the Tabular Model Definition Language format that underpins TMDL scripts and TMDL view interactions described throughout this article.
- Semantic link overview (Microsoft Learn). Microsoft’s reference for the Fabric library used here to inspect and manage published semantic models from notebooks.
In conclusion
The Power BI tool ecosystem is the richest and most abundant that it has ever been. For pro developers, this is a boon that gives us more options and approaches to be effective and efficient in our tasks. Each of these tools have scenarios and problems that they are tailored to address, but you might also prefer one over another (even if it is less “optimal”) for subjective reasons, and that is fine. Ultimately, what matters most is that you know what tools are available at your disposal, and how you can make better data models, faster.
Take your semantic models further with Tabular Editor.
Give Tabular Editor a spin