
Key takeaways
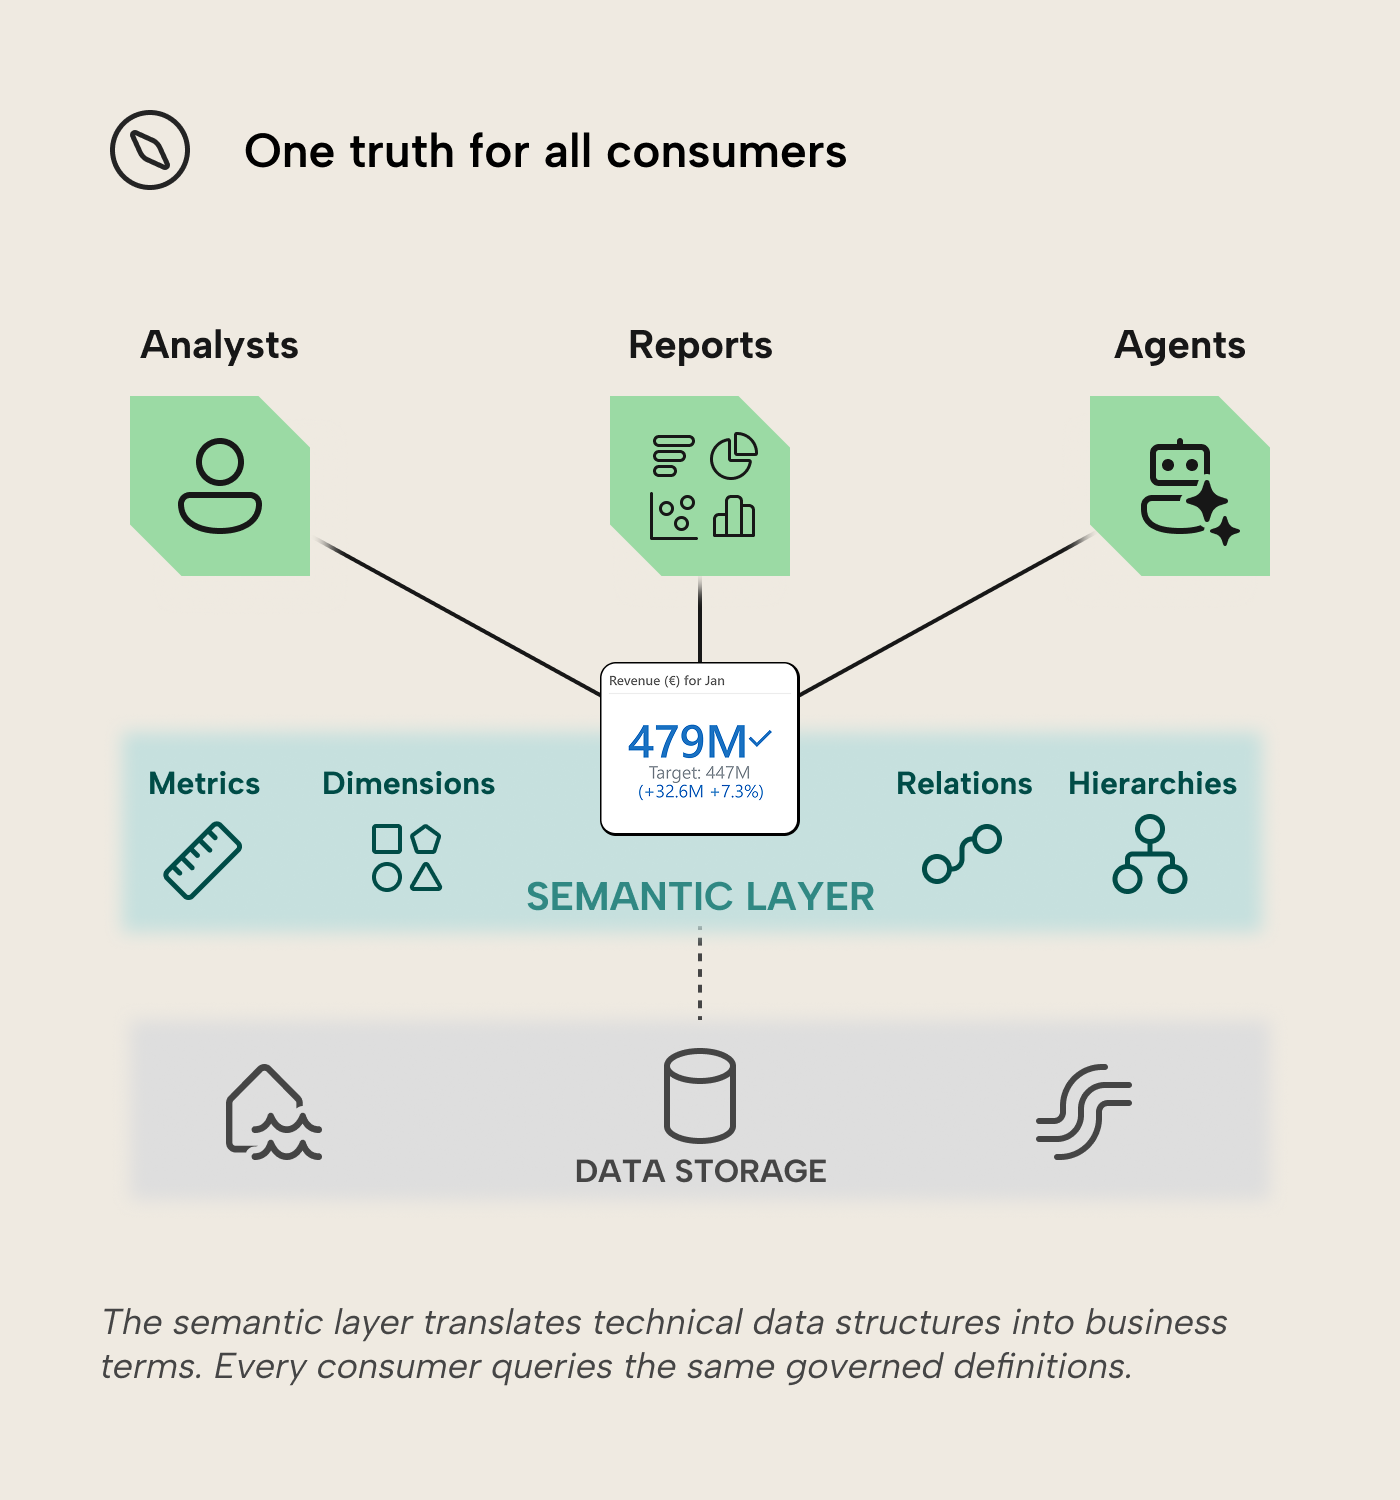
- A semantic layer translates data into business terms: It sits between data storage and analytics tools, providing consistent definitions for metrics, dimensions, and logic, defined once and reused everywhere.
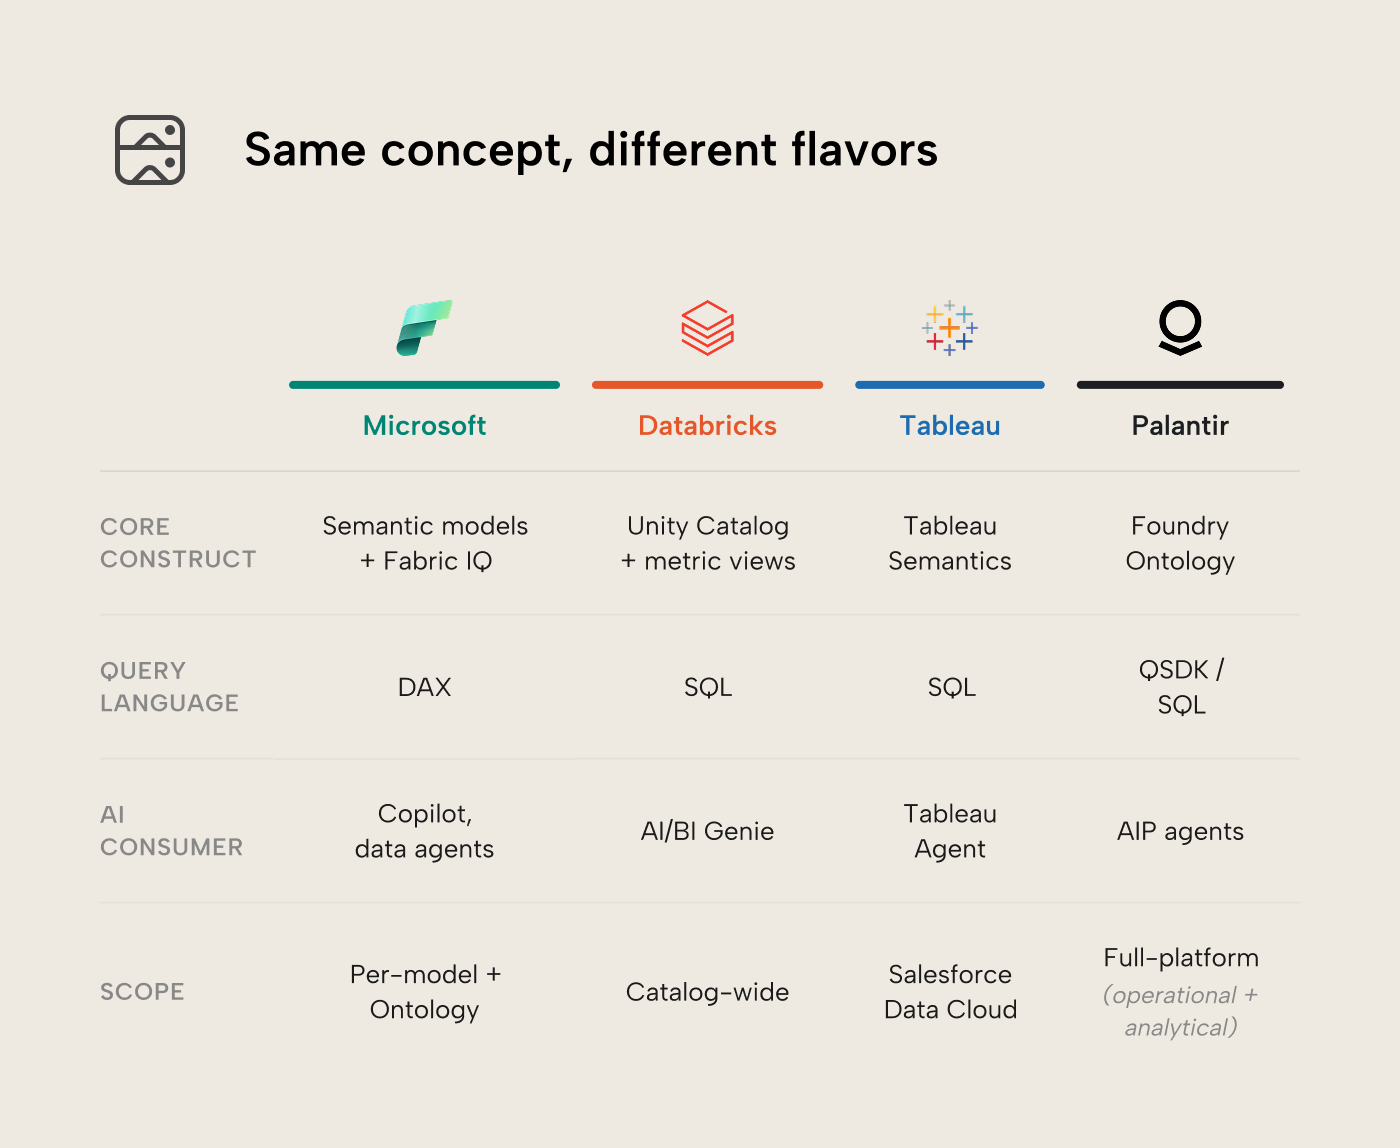
- Every platform implements it differently: Microsoft calls it a semantic model, Databricks a Metric View in Unity Catalog, Tableau uses Tableau Semantics, and Palantir builds it into its Ontology, but the purpose is the same.
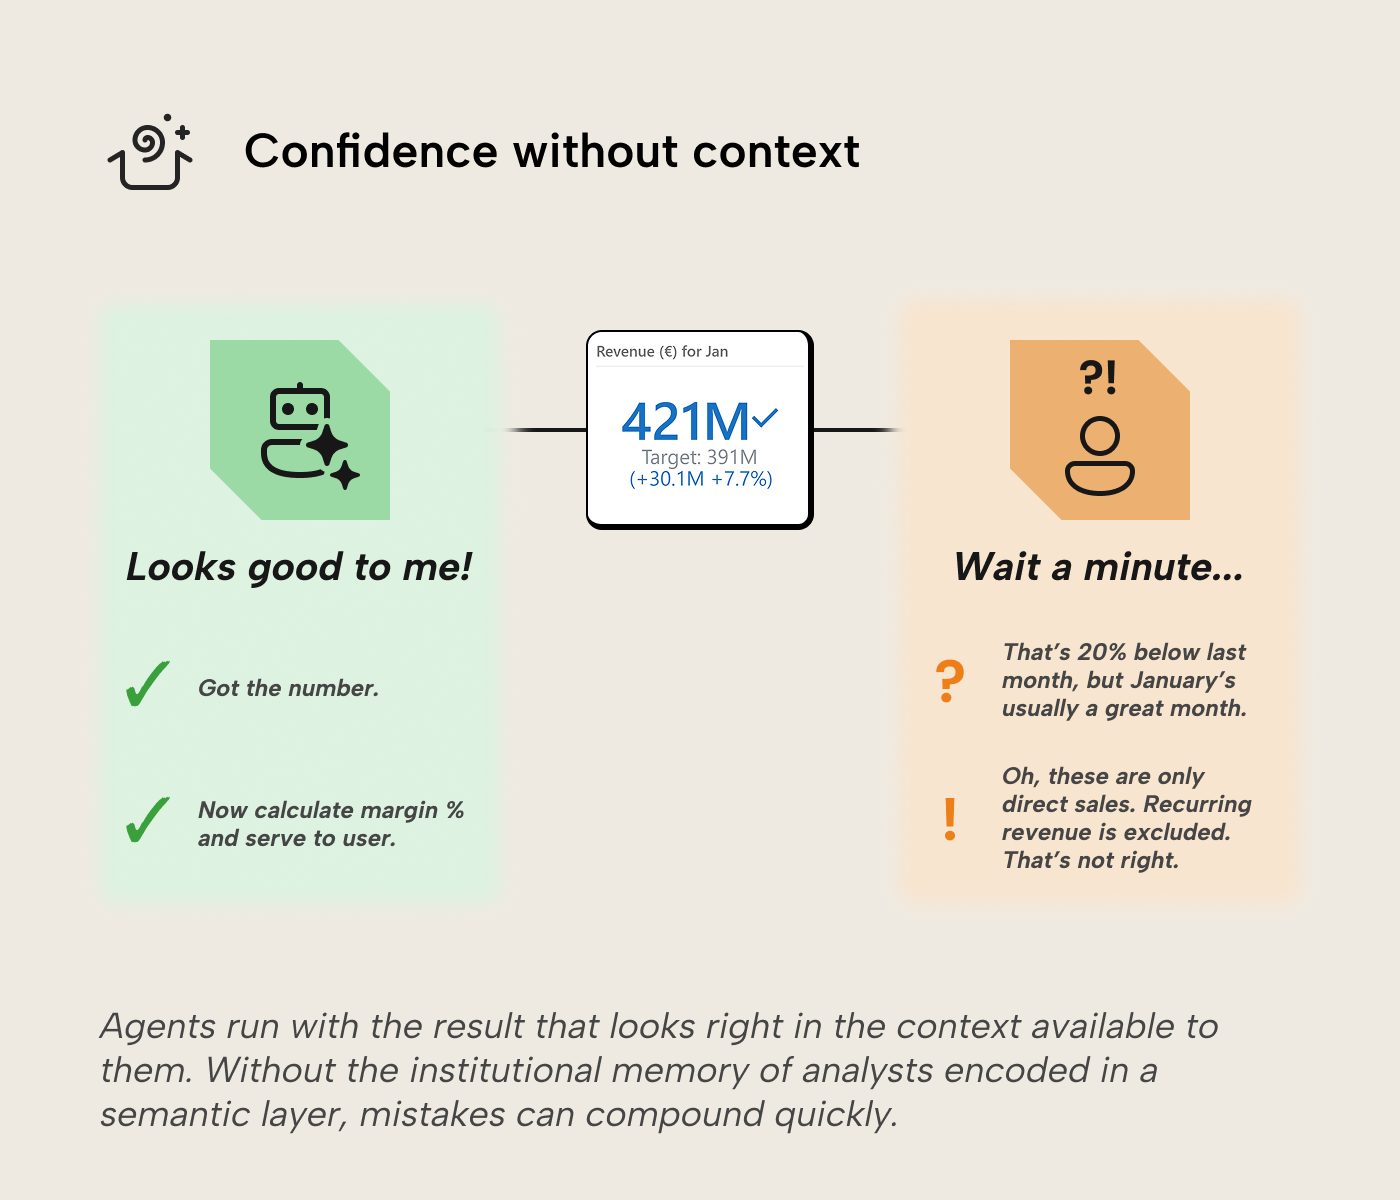
- It's institutional memory: A semantic layer captures business logic that would otherwise live only in experienced analysts' heads, which matters especially for AI agents that have no memory of their own.
With thanks to Greg Baldini for his contributions to this article.
Every data platform has a name for it: semantic model, metric view, ontology. The concept is the same: a shared layer that defines what business terms mean and makes those definitions available to reports, spreadsheets, APIs, and increasingly, AI agents.
Why have a semantic layer?
Before we define what a semantic layer is, it’s helpful to first highlight why it’s useful to have one. Many analytics teams hit (or have hit) the same wall at some point: inconsistent metrics. It often goes like this:
- Multiple teams build their own reports. They inevitably use the same metric names at some point, such as
Revenue. - Each team writes its own calculations: gross sales here, net of returns there, renewals included in one place but not the other.
- The
Revenuenumbers in the finance teams’ reports do not match theRevenuenumbers in the sales teams’ reports. Every report looks right in isolation, but the organization cannot align on what the correct number is across reports. - Teams must shift their focus from analyzing and automating to reconciling and integrating.
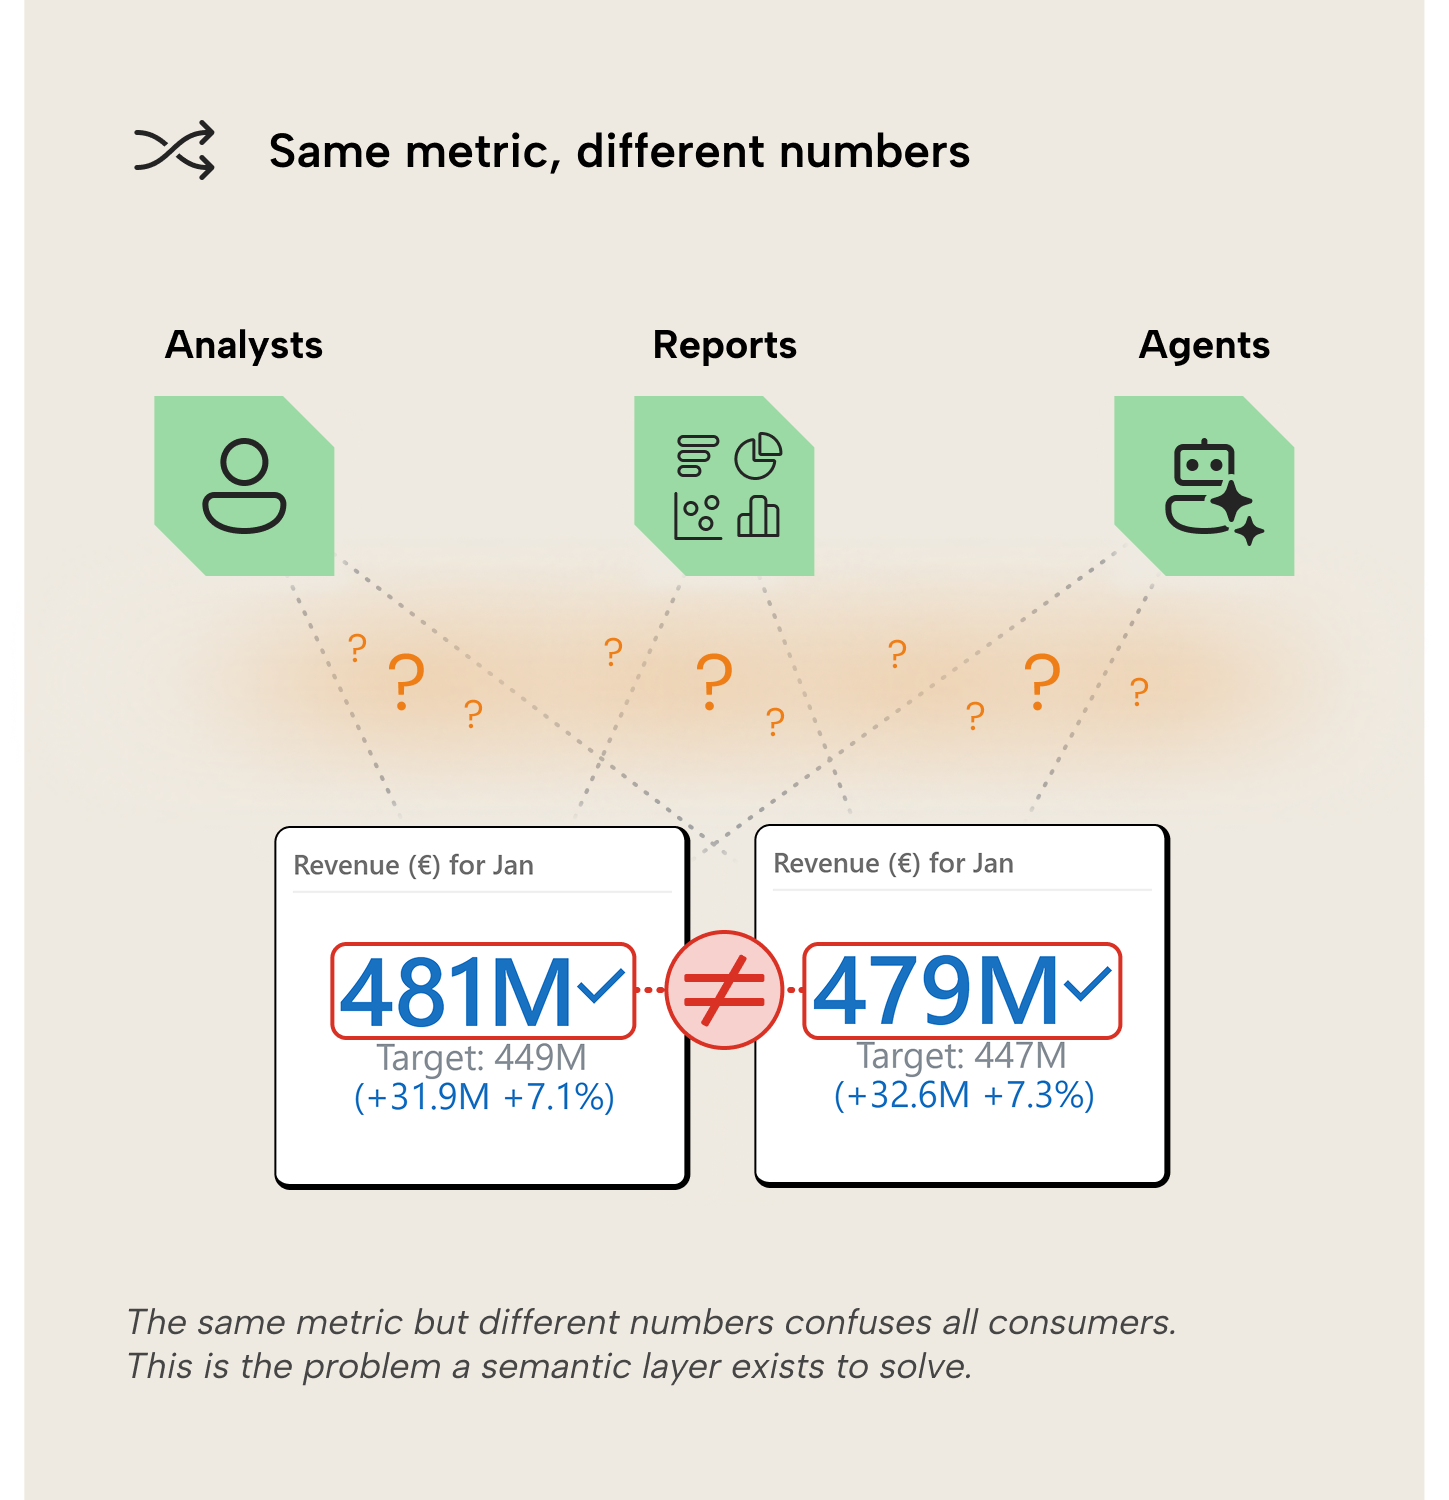
A semantic layer helps prevent this by centralizing business definitions. The same logic is defined once, documented, governed, and then reused everywhere, no matter which team or tool is asking the question. That includes AI agents, more on that later.
So what is a semantic layer?
A semantic layer is the part of a data stack that translates technical data structures into business terms. It sits between the data storage platform (commonly called “data warehouse” or “lakehouse”) and analytics tools, so analysts and business users can ask questions about data without rewriting logic every time. This definition isn't entirely ours but a synthesis of Databricks, dbt, and IBM’s definitions. Microsoft doesn’t define the term “semantic layer” separately; they go straight to the implementation: semantic models.
Microsoft: semantic models in Power BI, Fabric, and Analysis Services
Microsoft’s semantic layer starts with semantic models (formerly “dataset”), the same tabular model technology that powers Analysis Services. A semantic model layers business metrics, dimensions and calculation logic on top of data so reports and other tools can query them. DAX is the query language; VertiPaq handles in-memory storage; XMLA endpoints open the door to enterprise tooling and automation. Data in models can be accessed via VertiPaq in-memory cache or as a pass-through query to a source system with DirectQuery. Direct Lake, available in Fabric, is a third option that loads data from OneLake Delta tables into VertiPaq on demand.
Linking models across workspaces is possible through composite models, but carries significant limitations. In practice, semantic models tend to cover one or a handful of related business processes; decentralized. Teams can build their own model per domain or even per report. That flexibility is useful, but it increases the risk of definition drift unless models are intentionally treated as shared products with clear ownership, versioning, and re-use patterns. Dimensions like Customer or Product show up in many models, each with its own copy and its own definition. The inconsistency that a semantic layer is supposed to prevent at the report level can reappear at the model level.
Microsoft’s answer is a layer above the models: the Ontology. It defines re-usable business concepts (entity types like Customer, Order, Product), their properties, relationships, and business rules, and binds them to data sources: semantic models, lakehouse tables, eventhouse streams. The intent is to standardize business concepts across models and sources, so both humans and AI agents can reuse them consistently. Graph queries then traverse the relationships defined in the Ontology, unifying data from multiple bound sources (e.g. Customer → Order → Product to calculate ‘Revenue’).
Microsoft’s semantic layer operates at two levels: semantic models for per-domain business logic, and the Ontology in Fabric IQ for cross-source standardization. Semantic models are mature and widely adopted; Ontologies are ambitious but still new.
Databricks
Databricks implements its semantic layer through Unity Catalog, a unified governance layer for data and AI assets. The core construct is the metric view: a YAML definition that specifies measures, dimensions, and source tables. Metric views are queried with SQL using the measure function. Tools where analysts write their own SQL (notebooks and editors) consume metric views directly. Tools that generate SQL, like BI platforms, need to support the same measure function to query metric views correctly.
The philosophy behind this design is SQL-first and close to the data. The semantic layer in Databricks is thus less of a separate product and more a governed metadata layer on top of the lakehouse. For organizations using both Databricks and Power BI, Tabular Editor’s Semantic Bridge lets you import the structure and metadata of a metric view into tabular model objects, allowing you to re-use the business logic defined in Unity Catalog in Power BI semantic models.
Tableau
Tableau has historically embedded its semantic layer in the data model and calculated fields within workbooks. The model defines relationships, dimensions, and measures that feed directly into the visual layer. It's intuitive for analysts, but definitions live inside individual workbooks and are duplicated per report rather than shared and governed. If Power BI risks definition drift across semantic models, then Tableau risks it across workbooks through analysts that re-implement the same logic in new views.
Tableau Semantics is a more centralized attempt to address this issue, with metric definitions that connect into the broader Salesforce Data Cloud. The direction is the same as Microsoft's and Databricks': moving definitions out of individual workbooks and into a governed layer.
Palantir
Palantir’s Foundry platform centers on the Ontology: a layer that models real-world objects like customers/orders/equipment, their properties, relationships, and actions. Palantir’s Ontology models not just metrics and dimensions but also what objects do. It's a broader and more complex scope that could explain why they use the term “ontology” rather than “semantic layer”.
For organizations whose analytical and operational workflows are tightly coupled (like say, intelligence agencies), the Ontology can consolidate what would otherwise be stored in many separate systems. For organizations that primarily need governed metrics for reporting, it may be more architecture than the problem requires.
The semantic layer in the age of AI agents
The problem of inconsistent metrics gets worse when AI agents enter the picture. A human analyst who has worked with the organization’s data has absorbed the business logic through experience. When a revenue number looks off, they can often tell why: a regional filter wasn’t applied, a product line was excluded, or the magnitude of the discrepancy points in a clear direction. An AI agent has none of that institutional memory. The data doesn’t have to be dirty for it to fail; clean tables with accurate numbers still produce wrong results when the agent lacks context to pick the right ones. It finds a column or measure called Revenue, computes, and moves on. If that happens to be the wrong Revenue, gross instead of net, renewals included where they shouldn’t be, the AI agent builds on the error without second-guessing, compounding into a result that’s no longer recognizably flawed, but garbled nonsense. Unlike a human analyst who would hesitate, the agent serves that nonsense fast, with confidence, at scale.
This is where the semantic layer earns its keep more than ever: by making implicit knowledge explicit. The business context that experienced analysts carry in their heads gets encoded in a layer that every consumer can read. That’s useful for new analysts on day one, for future you revisiting the model in six months, and for the LLM that has no knowledge of your revenue logic because it’s not in the training data and (hopefully) not on the public web. The AI agent doesn’t have to guess what rev_net_adj_q3 means because its meaning is contained in the semantic layer.
Every major platform now has an AI consumer that leans on the semantic layer. In Power BI and Fabric, Copilot uses the semantic model as grounding data, fetching the schema, descriptions, linguistic schema, and other model metadata to interpret a user’s natural-language question. Hidden fields and tables stay out of Copilot’s reach, so model authors control what Copilot gets to work with. That makes model quality the bottleneck: if names are vague, descriptions empty, and synonyms missing, Copilot’s answers will reflect that lack of context. The Prep for AI feature helps by letting developers select which fields Copilot can see, define verified answers, and add contextual instructions. At the Ontology level, Fabric data agents and operations agents use the Ontology as a guiding layer to ensure metrics remain consistent regardless of which underlying sources contain the data.
The pattern repeats across platforms. On Databricks, AI/BI Genie translates natural language questions into SQL using Unity Catalog metadata, metric view definitions and analyst-provided instructions. Since October 2025, metric views also support semantic metadata (display formats, descriptions) that travel with the metric. A format defined on Revenue follows it wherever it’s consumed. Tableau’s AI assistants ground their responses in Tableau Semantics definitions, the same governed metrics that feed dashboards. Palantir's Artificial Intelligence Platform agents reason over the Ontology, working from the same object definitions, relationships, and business rules that drive operational workflows.
Regardless of flavor, the agent is bounded by what’s in the model. It can only work with the definitions the layer provides. That’s on purpose. Without a governed layer to attach meaning to numbers, every agent invents its own definition. This is the same problem that had teams reconciling drifted numbers by hand, except now the disagreement can spread at machine speed.
For further reading
- Semantic models: The brain for analytics, reporting, and AI with data (tabulareditor.com). This blog looks at the semantic model from the Power BI and Fabric angle on what a semantic layer means in practice, complementing the multi-platform comparison made in this article.
- What is a semantic model in Power BI: Simple guide (tabulareditor.com). A walkthrough of the Microsoft semantic model implementation.
- BI by Another Name (Benn Stancil). Benn argues that a well-maintained semantic layer can still feel like a constraint on genuine analytical exploration. This is a tension we haven't resolved either.
- Transactive Memory: A Contemporary Analysis of the Group Mind (Wegner, 1987). The foundational research on shared “who knows what” directories that underpins why externalizing business definitions in a semantic layer reduces organizational dependency on individual analysts. The semantic layer before it was cool.
In conclusion
The semantic layer is a concept that each platform implements differently but what needs to be done is the same: deciding what your metrics mean, then writing those definitions down and governing them, and finally making them available to everyone who needs it. Getting this right has always been worthwhile.
With AI agents increasingly consuming business data, the debt of skipping it will only compound further and faster. It’s no coincidence that all the major players mentioned in this article use the semantic layer as the basis for AI consumption of analytical data. Generative AI gives analytics a longer lever. To hold this sort of power, we need stronger foundations to support the speed, scale, and pressure that AI agents put on analytics processes. The semantic layer is that strong foundation.
Turn shared business logic into a stronger semantic layer with Tabular Editor 3.
Give Tabular Editor a spin