
Key takeaways
- DAX editors get scrollbar indicators: Errors, messages, and Code Actions now show as markers on the scrollbar, so you can jump straight to the issue.
- Expand Selection shortcut: Press
Ctrl+Shift+Eto grow your selection to the next logical code block. - Execute partial DAX in a query: Select any part of a DAX query, a
CALCULATEblock, or even a single object, then pressF5to run just that part. - Manage recent items: Right-click to pin, unpin, or delete recent items, plus refresh grouping and persisted Load-from-Database preferences.
Introduction
We are happy to announce a new version of Tabular Editor 3, which includes updates to our DAX Editor, enables a new way to execute DAX in DAX Queries, and makes it easier to handle your recent items in the File menu. There is also a little holiday surprise included– can you find it?
If you just can’t wait, do head on over to downloads to get the release. Also, check out our release video to see each of the highlighted features in action.
Watch the release video on YouTube
DAX editors
Tabular Editor 3 DAX editors have gotten a couple of new usability upgrades, which we are delighted to announce for the December 2024 release.
Semantic Analyzer and Code Actions scrollbar indicators
This nifty little feature combines all the DAX information that Tabular Editor has available from the Semantic Analyzer and Code Actions to help you fix issues and take action faster. The scrollbar in every DAX Editor now shows a little indicator in each place where your code has either errors, messages, or code actions, and hovering over an indicator will give a little tooltip to give you a short description of what the issue might be. Clicking on a scrollbar indicator navigates the cursor directly to the item, so you can look into fixing it right away.
If you find this feature distracting, you can toggle it off under Tools > Preferences > Text Editors > Show indicators on scrollbar.
Expand Selection shortcut
The first is a new shortcut (Ctrl+Shift+E) that expands any selection to the next logical code block. This is a small but super useful addition to how you interact with your DAX code.
Shortcuts are a hidden superpower that can help you lower the click tax – and Tabular Editor even lets you set your own if you want something different from the standard. You can even assign shortcuts to macros or other actions that are not bound by default to one.
Execute partial DAX code in DAX Query
Have you ever wanted to execute a part of your DAX Query to investigate what that part does or even which values a specific column has?1
Tabular Editor 3 lets you execute the parts of your code you like—just select them and press F5. These can be full EVALUATE statements, pieces of code such as CALCULATE statements, or even individual model objects such as tables, columns, and measures!
Take a look here at what that can look like:
1 No? Well, perhaps you will want to now.
What would be a practical use case for these new features? Check out our release video above, where Morten showcases a practical example! He illustrates how to extract a DAX query using Performance Analyzer. With the expand selection option and the partial DAX execution, he can easily understand how each query component plays a role in crafting visuals in Power BI. Here is a link to the exact timestamp: Release Video Power BI DAX Query walkthrough
Pin, unpin, and delete recent items
The recent items menu includes a right-click option to pin, unpin, or delete any of the recent items. This, along with the preference updates for setting the number of recent items, gives you full control over which items you want shown in the File menu.
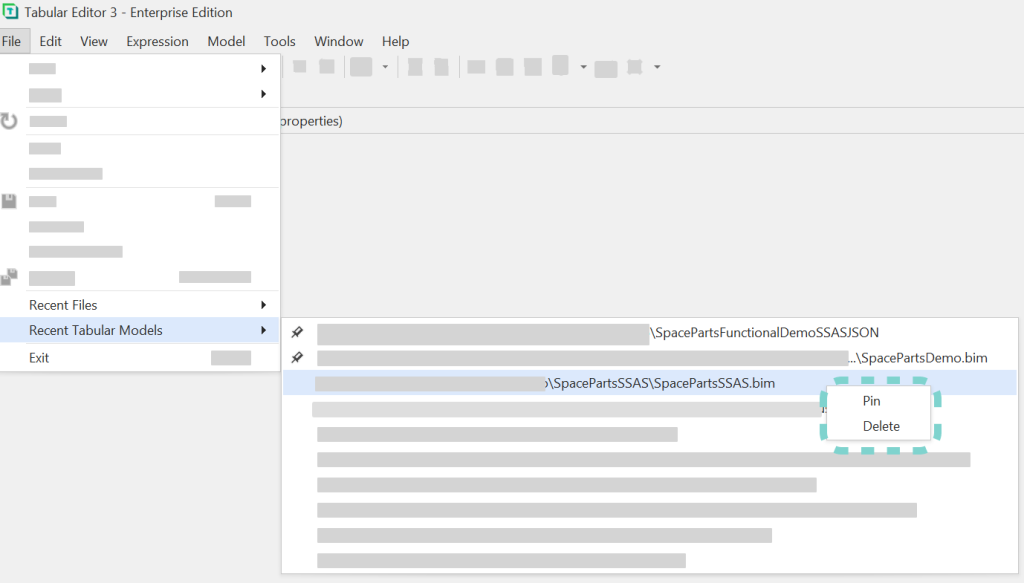
Figure 1: Pin, Unpin and Delete Recent items in the file menu
Improvements
We’ve made a few other improvements in the December release as well.
Data refresh grouping
The data refresh window now groups together each process event by the table that the event belongs to. This should make it quicker and easier to navigate and understand the refresh. We also fixed a bug in the data refresh window to ensure that the display doesn't reset when new events are added to it.
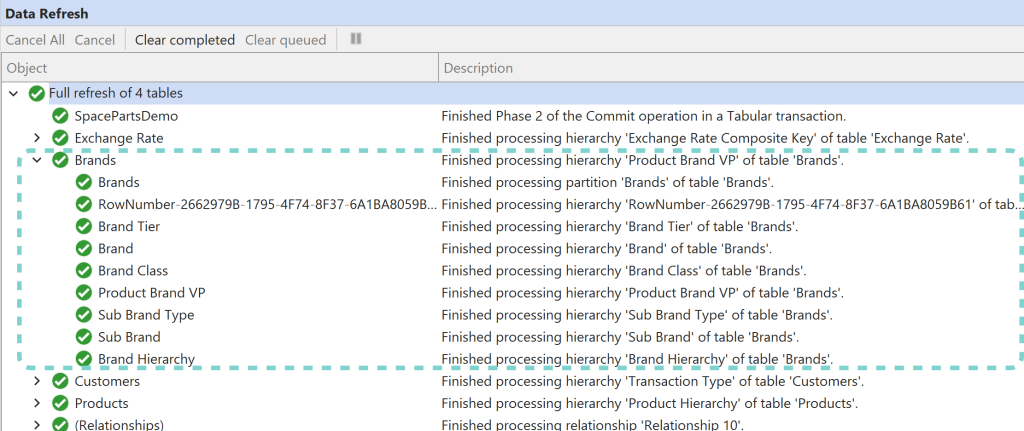
Figure 2: Data Refresh events are grouped to the table they concern
Load from DB preferences
The ‘Load Semantic Model from Database’ dialog box has several preferences that persist between sessions. Tabular Editor remembers the authentication type, username, mode, and status bar color for each server that you have connected to.
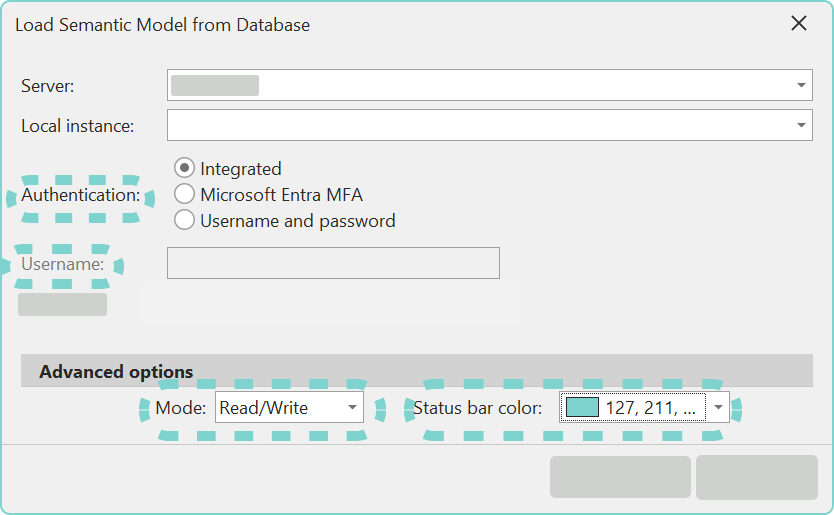
Figure 3: Settings in the ‘Load Semantic Model from Database’ are stored in between sessions.
Bug fixes
We have made multiple bug fixes in 3.19.0; please see our release notes for full details.
Code Action bugs
We fixed two bugs concerning code actions where an action was, in certain cases, not returning valid DAX.
If you have any feedback or experience any bugs, please reach out to us in our community forum. We look forward to hearing from you!
For further reading
- Quick-fix reference (Tabular Editor Docs). The Code Actions reference for the fixes surfaced by the new scrollbar indicators.
- Best Practice Analyzer (BPA) rules for semantic models (Tabular Editor). BPA complements the scrollbar Code Action indicators introduced here -- together they surface and fix DAX issues without leaving the editor.
- Report performance reference (Microsoft Learn). Microsoft's Performance Analyzer documentation, including how to copy visual DAX queries for inspection.
In conclusion
That's the December 2024 release: scrollbar indicators and an expand-selection shortcut in the DAX editors, partial DAX execution in queries, and more control over your recent items. Grab 3.19.0 from the downloads page, watch the release video for a walkthrough, and let us know in the forum what you'd like next.
Take your semantic models further with Tabular Editor.
Give Tabular Editor a spin

