Key Takeaways
- Similar but different UX erodes intuition: Agents building dashboards can come up with their own UX patterns. Inconsistent UX across dashboards erodes your users' intuition and can lead to misreadings.
- Dashboarding tools laid solid foundations we should bring along: Power BI, Tableau, and other tools paved the way. Now we can build pretty much any digital experience we can put into words, we should consider more carefully what we build, and why.
- Consistency matters most: We think the patterns put forth in this article are sensible defaults, you and your userbase may disagree. However you adopt them, do so consistently.
This summary is produced by the author, and not by AI.
Data visualization has entered the era of "articulate it and let AI build it". AI coding agents have cut the cost and effort required to create novel digital experiences, and the landscape of tools at our disposal to show data to our users keeps expanding. When each new dashboard can come with its own way of selecting, highlighting, and clearing selections, we run the risk of reinventing UX patterns in similar but different ways. Let's relate it back to -- what did you expect -- semantic models to show what we mean.
Similar but different revenue figures across dashboards destroy the user's trust in the data, which is why we build semantic models; the trusted asset that consistently produces correct numbers for whoever queries them. Similar but different UX interactions erode the user's intuition in using the dashboards, causing confusion and discomfort. Worse still, a KPI card that responds to a click in one dashboard but ignores a click in another dashboard can lead to wrong readings.
BI tools such as Power BI, Tableau, Qlik Sense et al. gave us good UX foundations. Not necessarily perfect, but good. You can think of this blog as a love letter to the UI/UX patterns these tools made a default, and at the same time an invitation to bring along what was already good into BI's new era of malleability, with some polish here and there. We want to spell out the most important patterns and why we think they are good defaults to consider, whether you're asking your agent to create a one-off dashboard, or whether you're developing a dashboard design system for the whole organization. Now anything we can define in code is within arm's reach to build, what we build deserves more thought.
UX patterns to cherish
Standardized UX patterns give users a foothold in novel experiences. If you give a Power BI user a new dashboard with data they've never seen before, their experience with known dashboards will lead them to expect that they can hover over a bar to get more information about that specific bar. If they click or tap a bar, they expect the other bars in the visual to dim, signalling that they are not part of the selection. Users transfer the expectations they built in one familiar product to another product that looks similar, Jakob's Law. There are more such patterns, and they're not all exclusive to Power BI.
Hovering over a mark shows the details of the mark
When you hover the cursor over a mark, a new frame ("tooltip") appears near the cursor to show additional information about that mark: the exact value, a full sentence with the value, or even multiple other visuals. Hovering a mark doesn't select the mark, so users can move the cursor across charts and read the tooltip of every mark without changing the selection.
Tooltips are great because they offer details-on-demand, meaning that detail does not have to weigh down the default view of the page but can be relegated to appear when and where it is needed. Tooltips are now such a commonplace pattern that dashboard users may think something is wrong if a mark doesn't show a tooltip, except for tabular visuals; these already show detail so more detail on top can be useful but not necessarily expected.
Since the cursor is occupied by hovering the mark, users can't easily interact with the content of the tooltip to answer follow-up questions the additional information may elicit. We think a tooltip should only show information, apart from one-click buttons such as drill through. Anything else users need to click, scroll or filter belongs in a less transient element such as a page or panel that stays open, as Microsoft advises for report page tooltips in Power BI and the W3C's guide to accessible websites suggests for tooltips on any website.
On touch screens, hovering is not an option, and a short tap selects a mark the same way a click does. Power BI mobile apps require the user to tap and hold a mark for a tooltip to appear. Tableau, in contrast, lets a short tap both select the mark and open the tooltip.
TIP
Tap and hold is a gesture your users might not be aware of, and if nothing on the screen tells them, they might miss that interaction entirely. Nielsen Norman Group warns that such mobile gestures "are not discoverable".
Which pattern do you then adopt for touch screens? Tableau bundles actions that users may want to perform separately into one input, and Power BI's tap and hold pattern is a hidden gesture but offers a useful distinction between both interactions (show a tooltip for this mark, select this mark). This is where judgment comes in: which of the two patterns will your users find more intuitive? It depends on the habits your users have formed. There is a third option that keeps the distinction of tap and hold and makes the distinction visible: a tap on a mark only opens the tooltip, and the tooltip shows a button that selects the mark.
Viewing the tooltip for a mark then never changes the page. The select button shows users how to select at the moment they want to select, so the page needs no permanent instructions; standard taps progressively disclose the options as users go. A phone has no Ctrl key to support multi-select, so the tooltip can also show a button that adds the mark to the selection. The cost of avoiding hidden gestures and permanent instructions is taps, and lots of them. This pattern is for touch screens only; mouse users shouldn't pay a click tax when their hover can show the tooltip.
TIP
A popup with a button in it is arguably no longer a tooltip. A tooltip only describes the element under the pointer, and the tooltip closes when the keyboard or the pointer moves away from that element, so keyboard users can't Tab their way to a button inside of a tooltip (W3C, draft tooltip pattern). On a web page, you could build this popup as a non-modal dialog, i.e. one that remains open while you tap elsewhere on the page.
Clicking a mark selects the mark
In Power BI, if you click or tap a mark (such as a bar of a bar chart or a point in a scatter chart), that mark is selected and the other marks in the chart are dimmed. Ctrl+clicking more marks includes them in the selection. A second click or tap on a selected mark clears the selection, unless there are more marks selected in the chart; then the click keeps only the mark selected with the second click.
Dimming the other marks keeps them in view so the selected mark can still be compared with the rest. A second click on the same mark clears the selection, so a single selection is as easy to remove as to make.
TIP
This is an illustration of Ben Shneiderman's permit easy reversal of actions rule, from his eight golden rules of interface design. We don't name them all here, but they are a north star for this article and anything you build for users.
In a Power BI report, a click on a mark that is not selected replaces the whole selection, and a click on empty space in the chart clears the selection. This makes building elaborate multi-selections feel fragile, because one misclick loses it all. Undo and Redo actions that keep track of selections resolve this problem.
By itself, this pattern doesn't offer the user much. It's the combination of that selection then acting as a filter on the other visuals on a dashboard page that makes it an interactive exploration powerhouse.
A selection affects other charts on the page
Clicking a mark in one chart changes what the other charts on the page show. Seeing this for myself the first time was the Wow-moment that sold me on Power BI. Cross-filtering and -highlighting interactions let visuals pull double duty: show data and act as a filter. We showed how to leverage this principle in dashboard design in a separate blog, Interactive data visualization in Power BI reports.
When a user arrives on a dashboard, their eye is often drawn by marks; a bar that is comparatively much shorter than its siblings, or shorter than the user expected. Did revenue drop by that much? Why?
Clicking and applying that bar's value as a filter to the other visuals lets the user seamlessly look for hints that could answer the Why. Maybe one specific product segment underperformed hard, or maybe all product sales seem to suffer equally. Creating multi-selections by Ctrl+clicking across visuals allows further deep drills into subsets. What about this product segment in this period of time?
In Power BI, this pattern only affects the visuals on the page the user is on and drillthrough actions are used to pass filters on to entire target pages. This is a good default because every chart that the selection affects is on the page the user is on, and a selection never changes a page that the user cannot see.
On portrait screens like phones, users may have to scroll down to see the charts that respond to a selection. This makes the exploration loop we described earlier feel less natural because affected visuals need scrolling to see. Separate layouts for mobile help (which Power BI reports support), but exploratory dashboards that need heavy use on portrait screens should be built for the portrait layout.
Charts highlight or filter a selection
This is about how the preceding pattern is applied. Some charts can respond to the interaction by cross-highlighting: keep all marks visible but draw the selected parts inside them darker, so the total and the share of the total remain visible.
This is useful for part-to-whole comparison, but only works elegantly for chart types where the selected value can be drawn on the same mark as the full value. In Power BI, a bar or column shows the selected value as a second bar from the same baseline, a pie slice as a sector with a smaller radius, and a treemap tile as a band along the bottom of the tile, so the user reads both values from one mark without learning anything new. In contrast, a point in a scatter chart shows its values as a position, so the selected value of a point needs a second set of coordinates. We elaborate on this conundrum in our article Fabric Apps explained: Visualization as code in a data app dashboard, where Power BI sidesteps the problem by letting scatter charts only receive cross-filters, not -highlights.
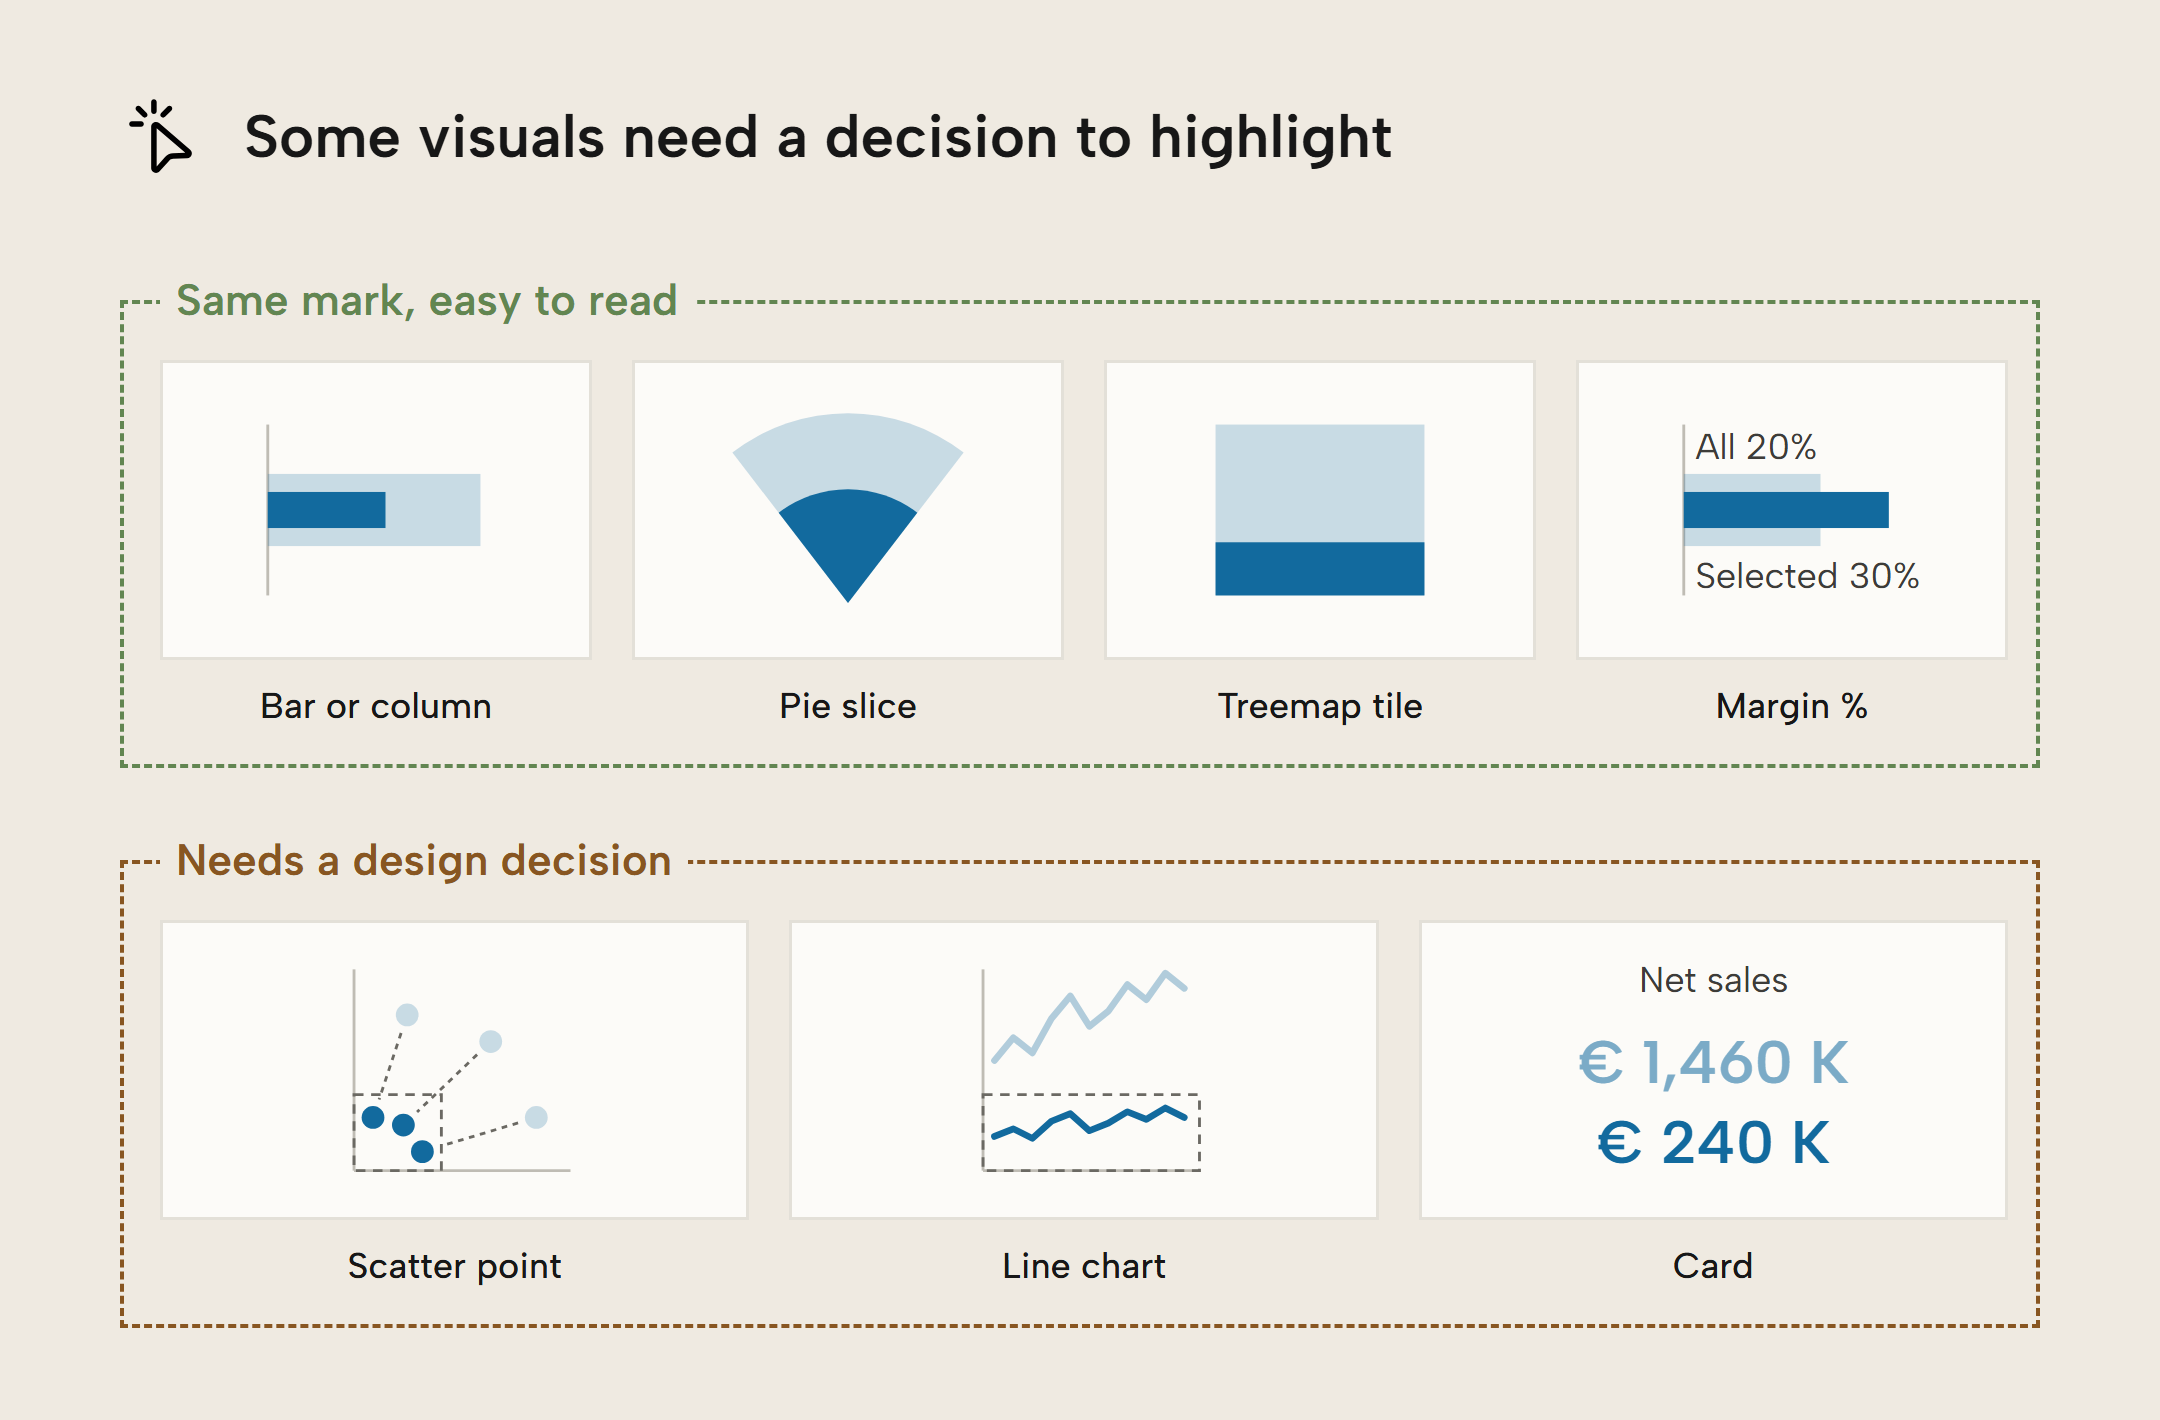
Cross-filters are better when the comparisons across marks are important in the affected visuals, so bars of a bar chart, for example, get their axis rescaled to the selected values and comparisons of the subsets become easier to read. They are also a way to avoid making an extra per-chart design decision.
The dashboard shows its state
It's easy to get distracted, forget you applied a filter (or selected a mark that filters), and draw a wrong conclusion. For dashboard authors, one of the usual suspects when investigating claims about wrong data is the user themselves: were they looking at a filtered state without being aware? With multiple selections spread across visuals it can be especially tricky to know which intersection you're looking at. The interaction principles described earlier make dashboards stateful things; the view you open the dashboard in is not the same state as the view after applying filters.
Opaque states serve no one and interactive dashboards should always show their state in a consistent way. Qlik Sense does this well: it lists every active selection in a bar at the top of the sheet. In Power BI, state tracking is scattered: dimmed marks in the charts show where selections were made, slicers state which single value is selected (multiple become "Multiple selections" in dropdown slicers), and the filter pane shows which visual- and report- and page-level filters are active, if the pane is even made visible to users at all. Individual visuals should also show their state, for example through a filter icon that reveals which filters are active, including fixed filters set by the author. Power BI report visuals do this by default. This helps prevent puzzled users from thinking a visual without marks is broken; often it's just a combination of filters that yields an empty subset.
WARNING
When you select a mark and then filter it out, the selection remains active but disappears from view, and the other visuals go blank because you created an empty subset. This can be very confusing if nothing on the page says that a selection is active.
We think a good way to show state is an element like this:
- a box placed on a similar place across dashboards, such as the top right of the page
- the box states the state: something like "Default view" for the initial state, and "{N} changes active" counting how many changes from the default are active
- when changes are active, the box can be opened to show which changes are active, preferably in the order the user made them
- changes should be individually removable, without affecting others
- a reset button to go back to the default view is a nice touch
- each visual shows the filters that apply to it, including filters the author set on that visual, for example behind an icon in its header
Further Reading
- Interactive data visualization in Power BI reports (Tabular Editor). Our blog on how to leverage cross-filtering and -highlighting in dashboard design. Make visuals pull double duty: show data and act as a filter.
- Change how visuals interact in a report (Microsoft Learn). How Power BI does visual interactions, where many of these patterns already exist.
- Coordinated Highlighting in Context (Perceptual Edge). A deeper dive on highlighting and filtering as responses to a selection in another chart, by data viz legend Stephen Few.
Conclusion
Interactivity and the swift exploration it enables should not be an afterthought in dashboard design. When an agent builds a dashboard, it can freewheel into existence its own UX patterns. Scaled to an org's dashboard estate, this becomes a UX Tower of Babel where no user is confident in using any dashboard because each dashboard behaves in its own specific way. Inconsistency erodes your users' intuition and can lead to misreadings.
We can and should have different UX when it would help human understanding of the data more than it harms expectations about consistency. The patterns and preferences we list are good defaults to go for, in absence of knowing your user's preferences. For you or your userbase, the choices might be different. If so, make them consistently.
All dashboards need solid semantic models.
Give Tabular Editor a spin